Collaborative Spotify Playlist Generator
Introduction
Music streaming platforms have revolutionized the way we consume music. Among these platforms, Spotify stands out with its 433 million active users in 2022 and a vast database of over 80 million songs. Recognizing the potential of this data-rich environment, we embarked on a project to create a custom playlist generator. Unlike Spotify's existing "Blend" feature, which only merges songs from two users' existing libraries, our tool introduces users to entirely new tracks based on their combined musical tastes.
The Problem
Spotify's "Blend" feature allows two users to generate a shared playlist from their existing song collections. However, it doesn't introduce them to new songs that neither has heard before. Our goal was to bridge this gap and create a tool that generates playlists with novel songs based on the combined preferences of multiple users.
Our Solution
Utilizing Spotify's developer platform and the Python library, Spotipy, we built a model that takes inputs from multiple users in the form of existing playlists. The model then generates a new playlist composed of songs that align with the users' tastes but aren't already in their libraries.
-e46752e1.png)
Data Collection and Preprocessing
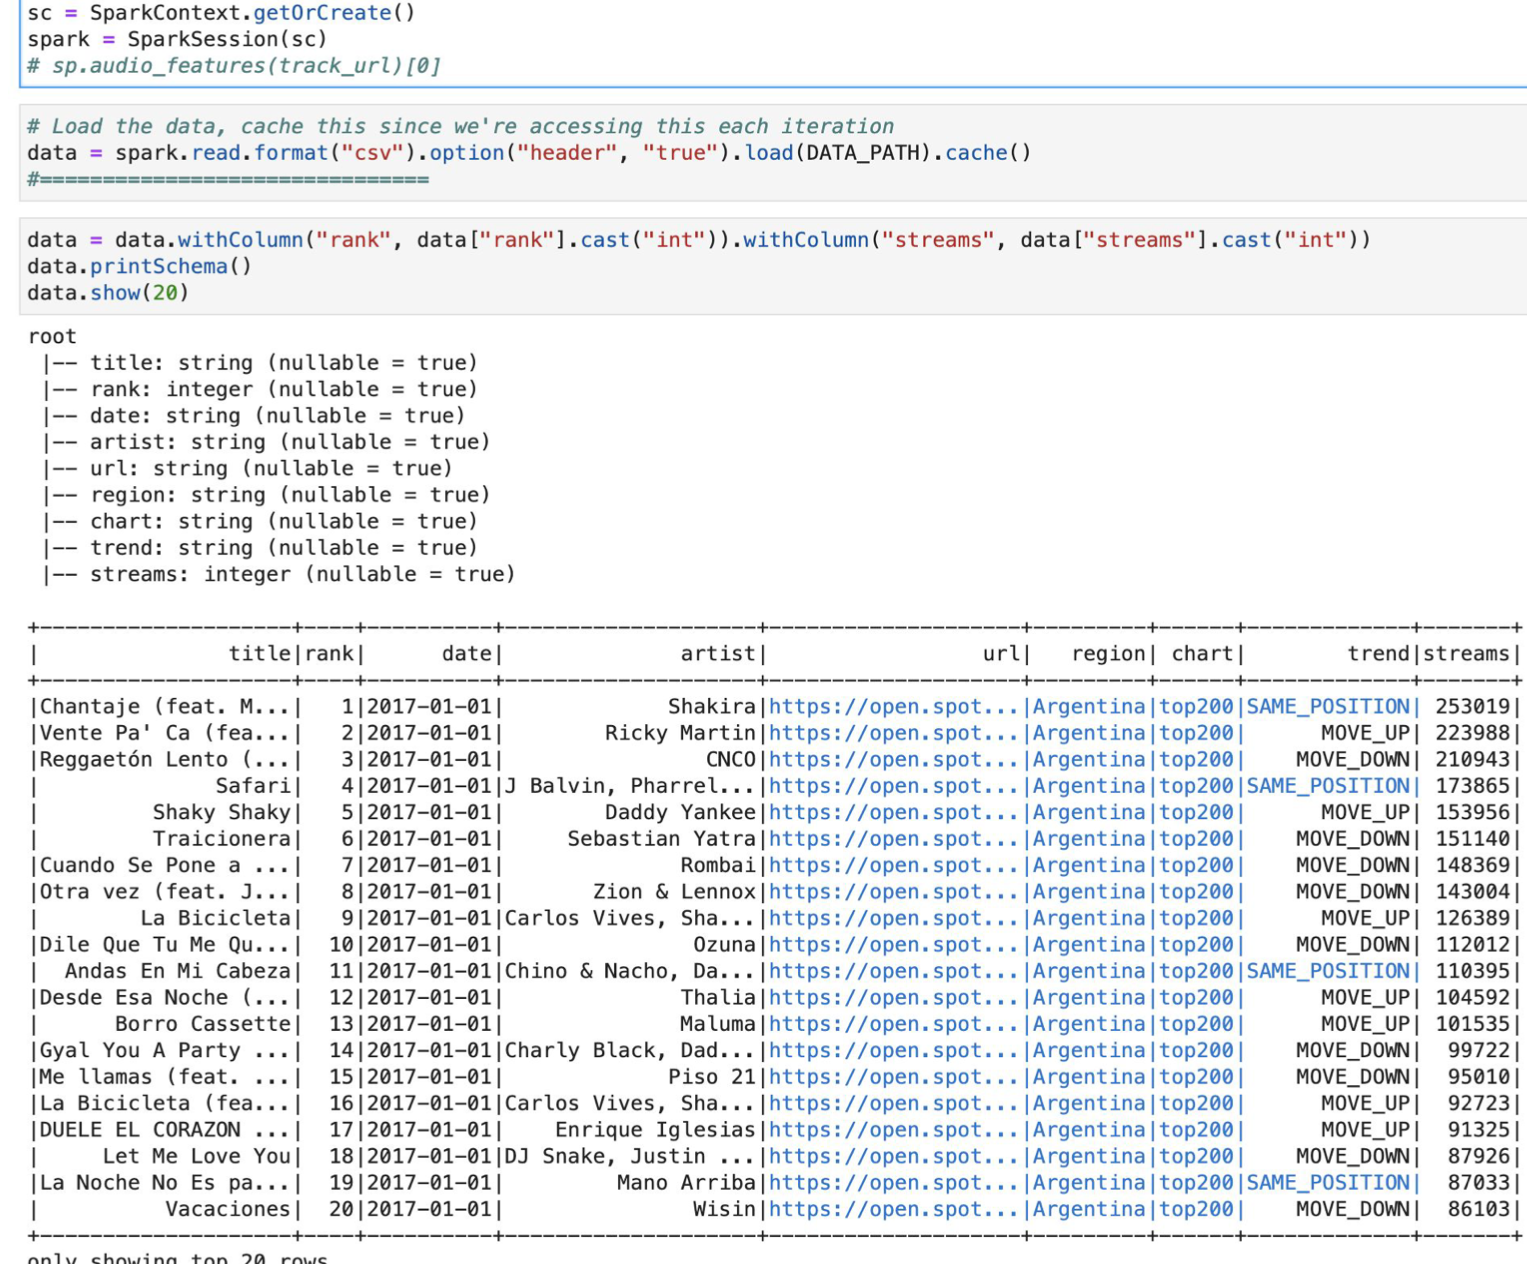
Our primary dataset was sourced from a Kaggle dataset containing 26 million songs. Due to API limitations, we narrowed this down to a subset of the top 100,000 tracks. This dataset was then processed using Google Cloud Platform and Spark to extract essential features like danceability, tempo, and energy.
Exploratory Data Analysis (EDA)
Exploratory Data Analysis (EDA) is a foundational step in the data analysis process. It involves visualizing, summarizing, and interpreting the information that is hidden in rows and columns of data. For our Spotify playlist generator project, EDA was crucial in understanding the underlying structure of the data, the relationships between variables, and the potential challenges in modeling.
1. Data Distribution:
- Genre Distribution: One of the first visualizations we created was a histogram of song genres. This helped us understand the most prevalent genres in our dataset. As observed, pop songs dominated the dataset, which is reflective of global music trends.

2. Feature Relationships:
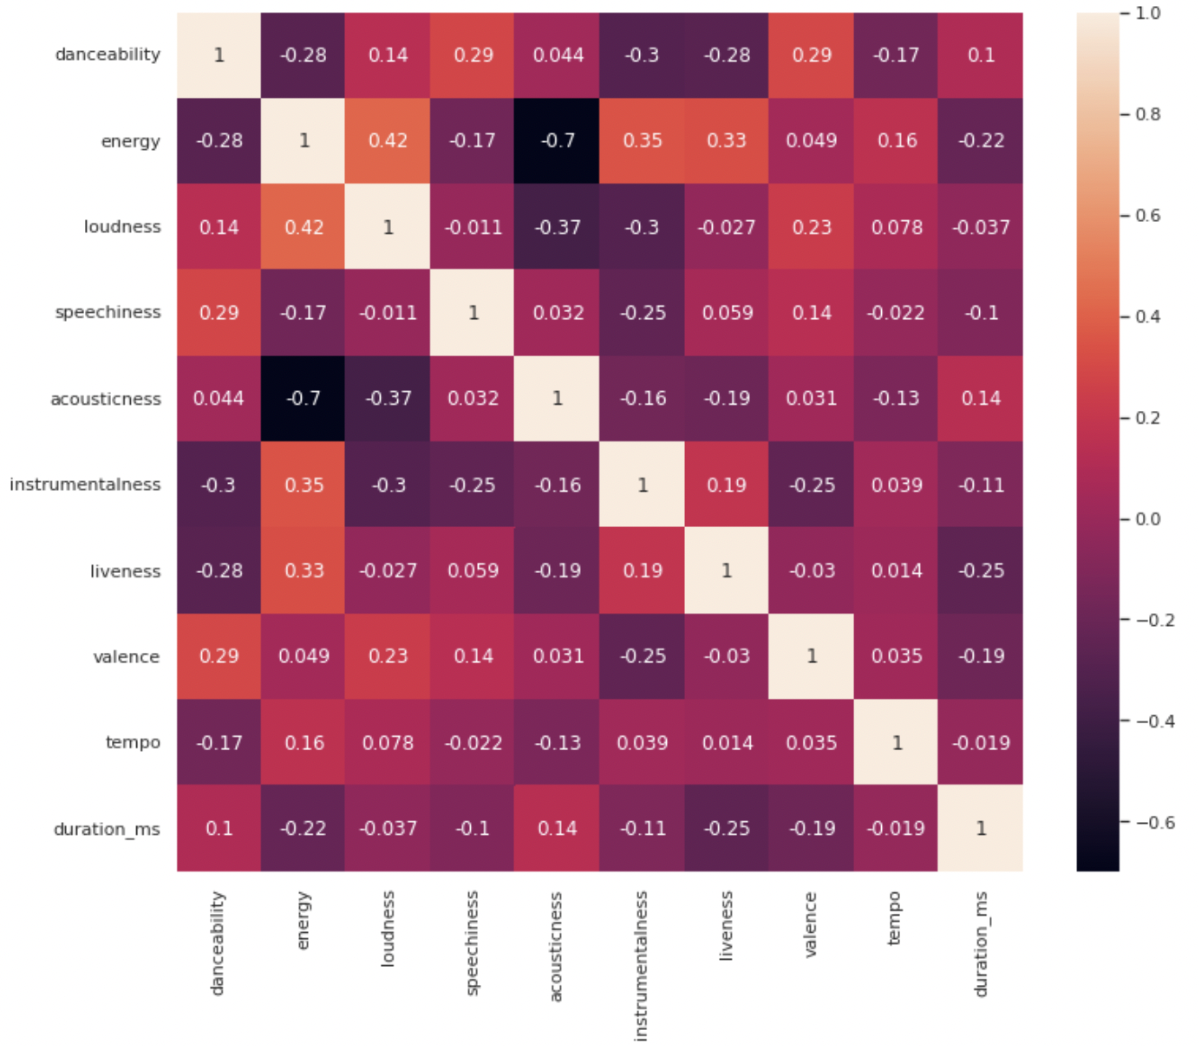
- Feature Correlation: We examined the correlation between different song features. For instance, there was a positive correlation between energy and loudness, indicating that louder songs tend to be more energetic. Conversely, energy and acousticness were negatively correlated.
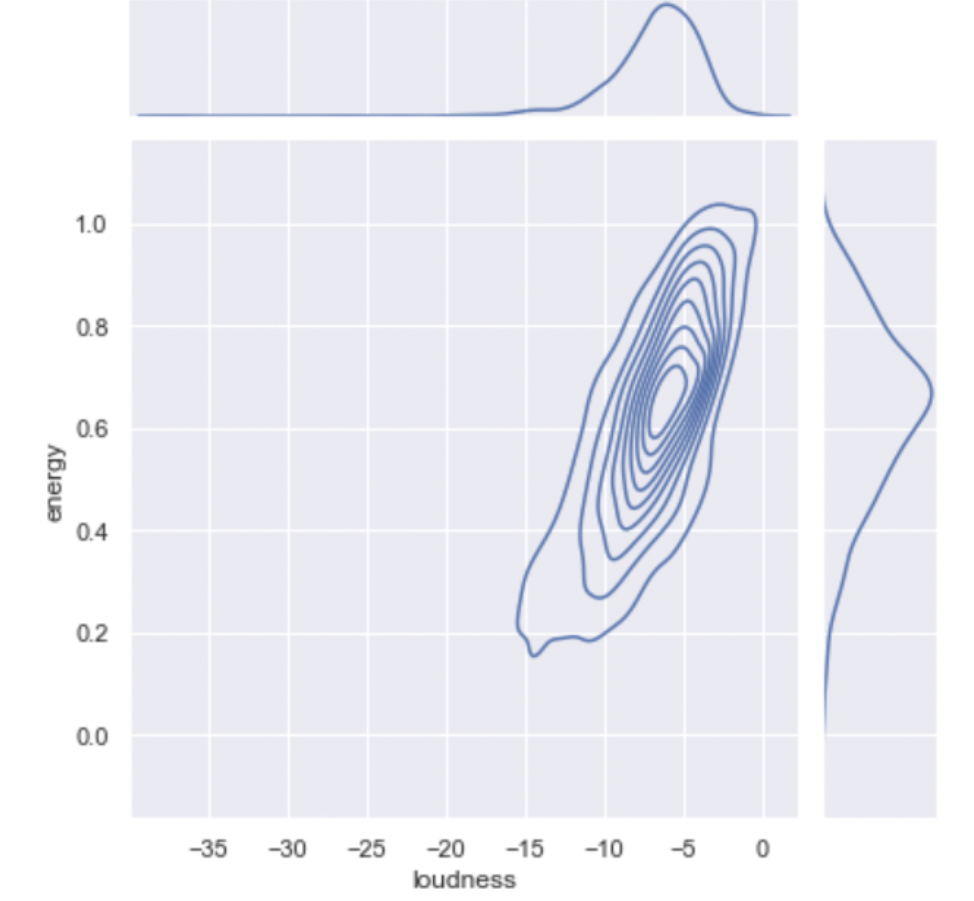
- Energy vs. Loudness: A level curve graph was plotted to delve deeper into the relationship between energy and loudness. This visualization reaffirmed our earlier observation: songs with higher loudness levels also tend to have higher energy.
3. Song Characteristics:
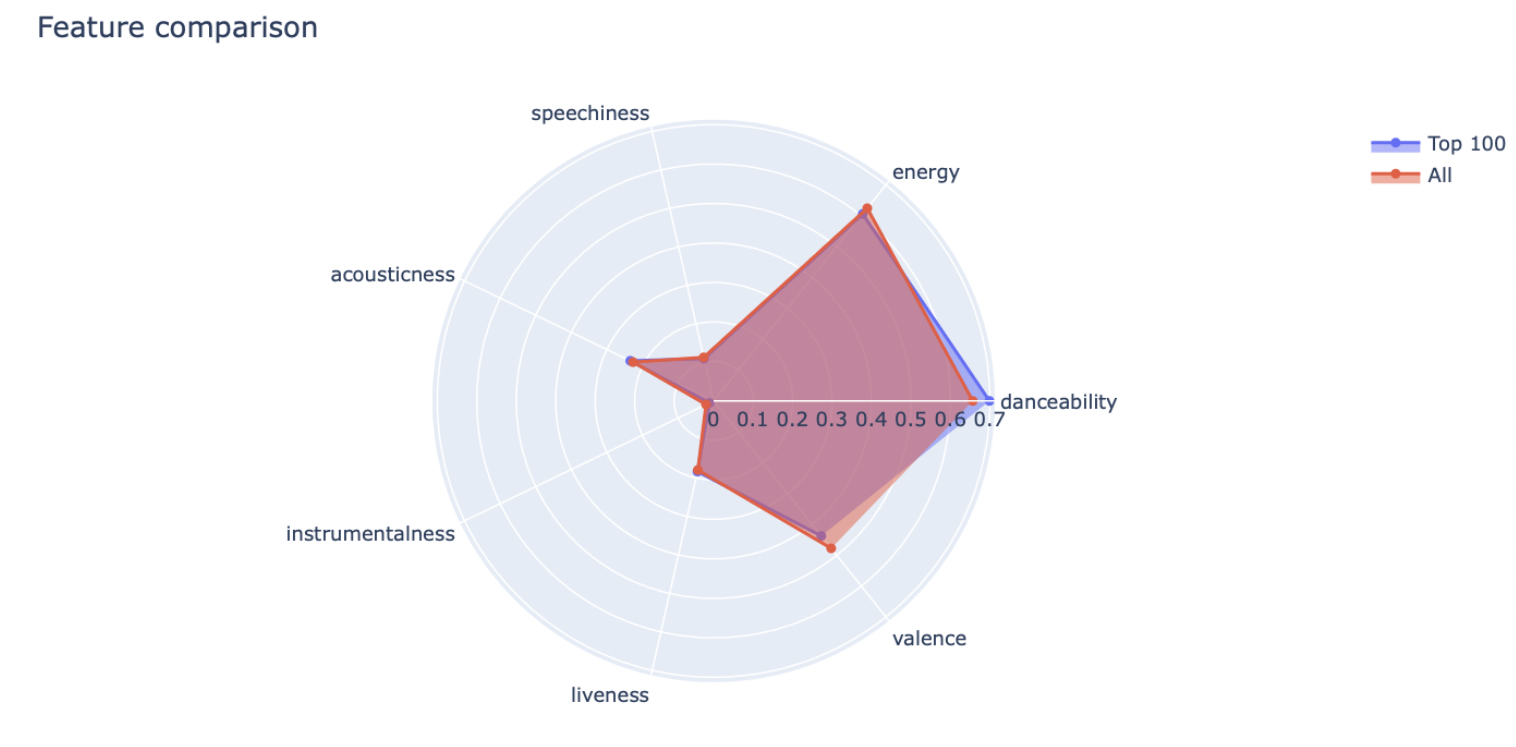
- Polar Graph of Audio Features: To get a sense of what might make a song popular or resonate with listeners, we plotted a polar graph of various audio features. Danceability emerged as a significant factor, suggesting that users might prefer songs they can dance to.
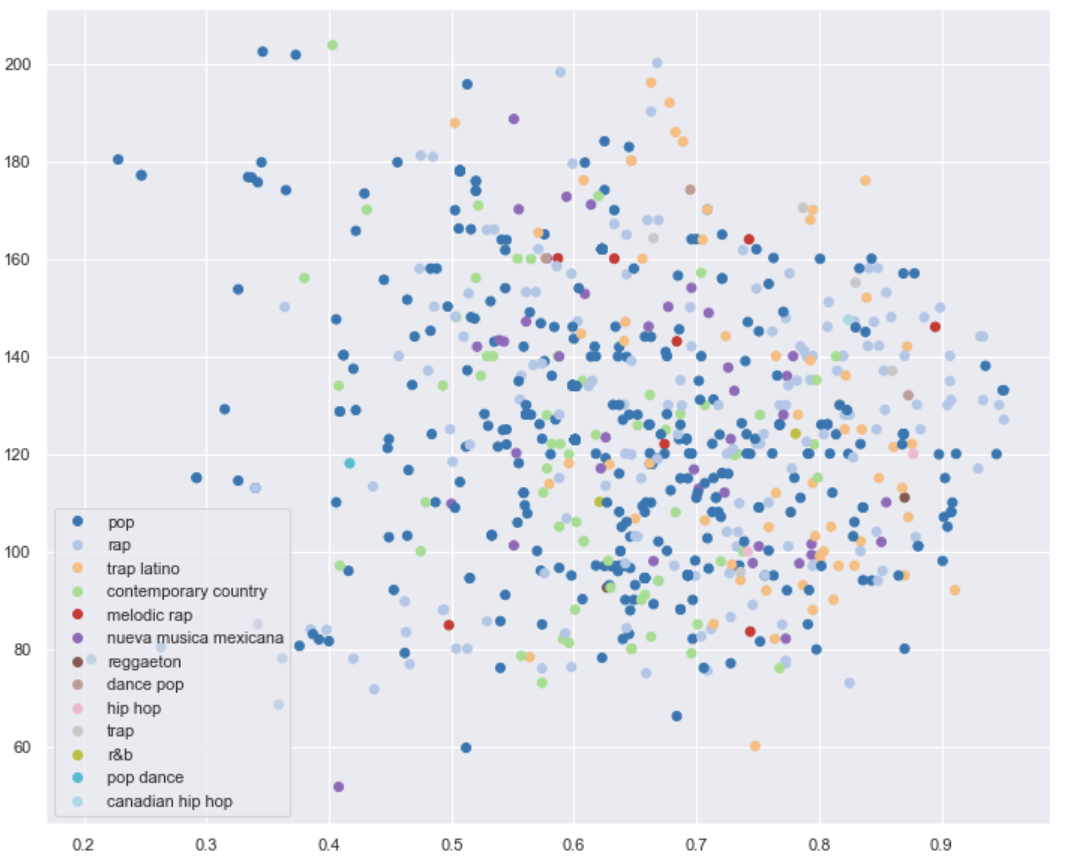
- Danceability vs. Tempo: We visualized songs based on their danceability and tempo, color-coded by genre. This visualization revealed genre-specific trends, such as trap Latino songs having higher danceability compared to rap songs.
4. Clustering Attempts:
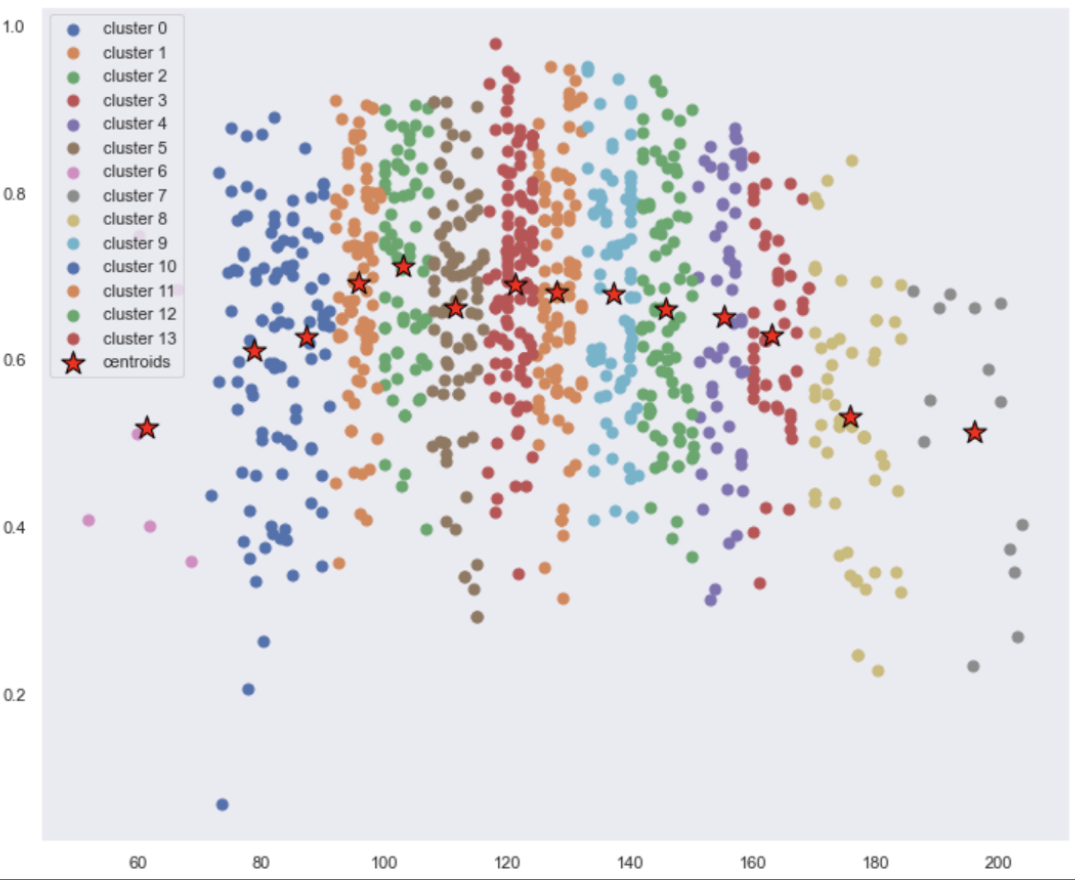
- K-means Clustering: We attempted to cluster songs using K-means to see if distinct clusters would emerge based on genres or other features. However, the results were not as distinct as we had hoped, indicating the complexity and multi-dimensionality of our dataset.
5. Data Sparsity:
Dataset Overview: A significant observation was the sparsity of our dataset. This was crucial as it informed our decision to not rely heavily on density-based clustering methods, which might not perform well on sparse datasets.
The Models
Baseline Model:
Our initial approach used variance-based feature selection. By analyzing the variance within the features of tracks in a user's playlist, we identified the most consistent qualities in their music taste. Using these features, we then selected songs from our library that closely matched this profile.
K-Nearest Neighbors (KNN):
We also experimented with KNN, using grid search to optimize the number of neighbors. This model looked at the closest songs in feature space to the user's preferences to generate the playlist.
Random Forest Classifier:
Our final and most effective model was the Random Forest Classifier. This model classified songs as "good" or "bad" based on the combined preferences of the users. It then generated a playlist of the top "good" songs.
Web Application
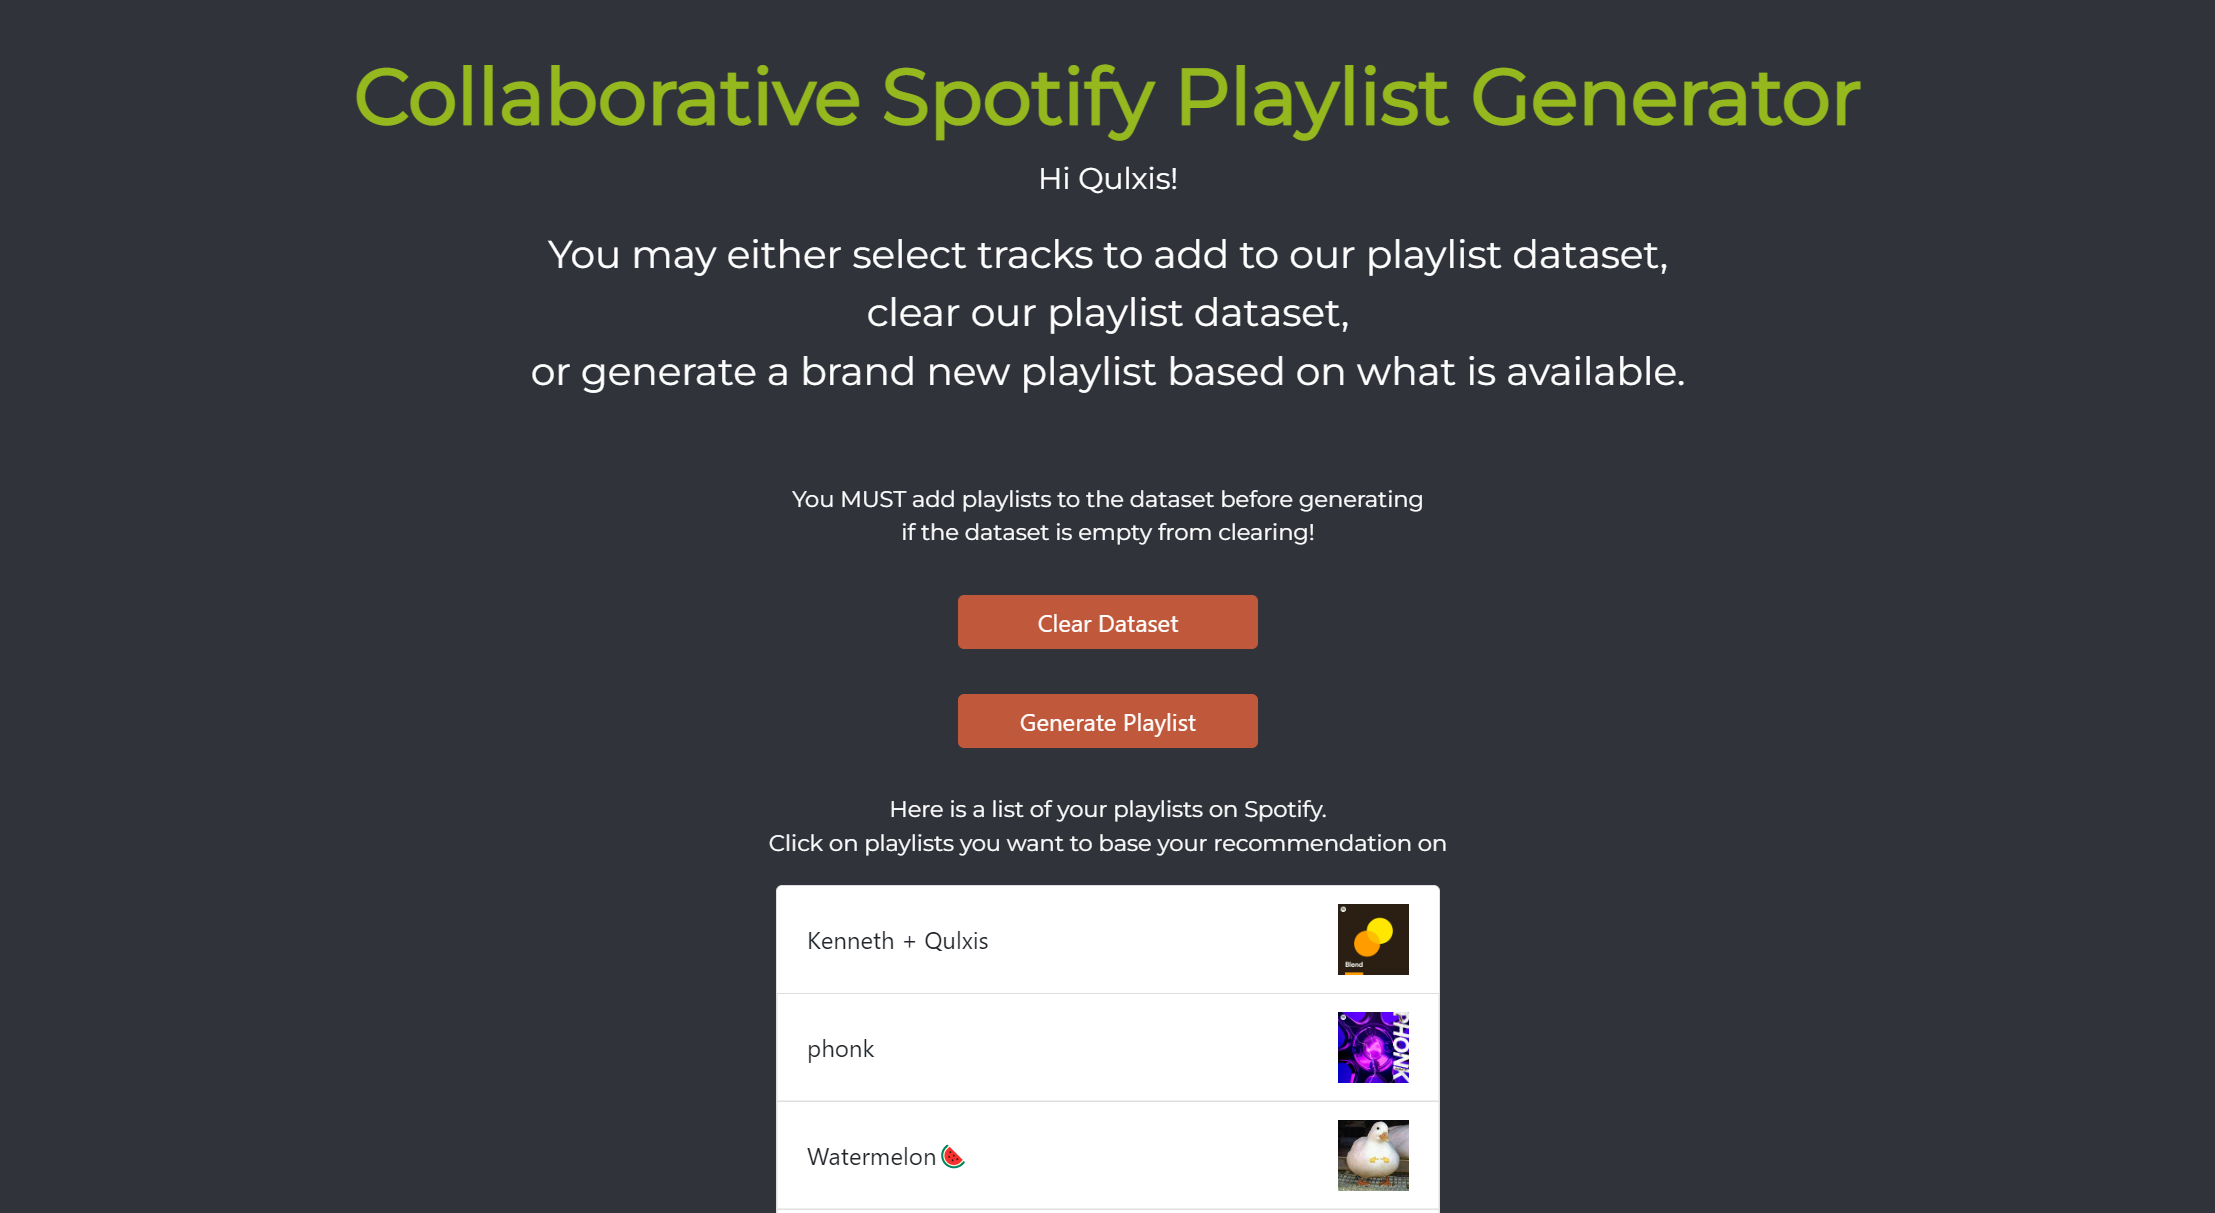
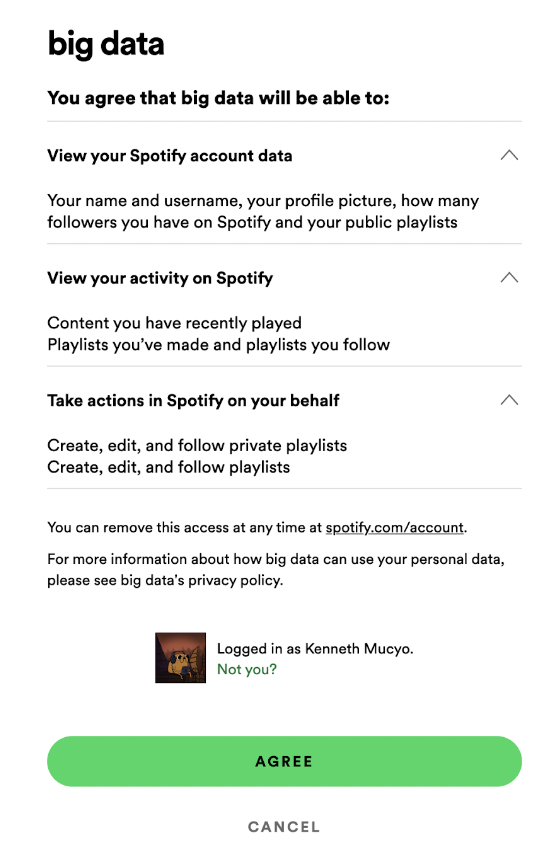
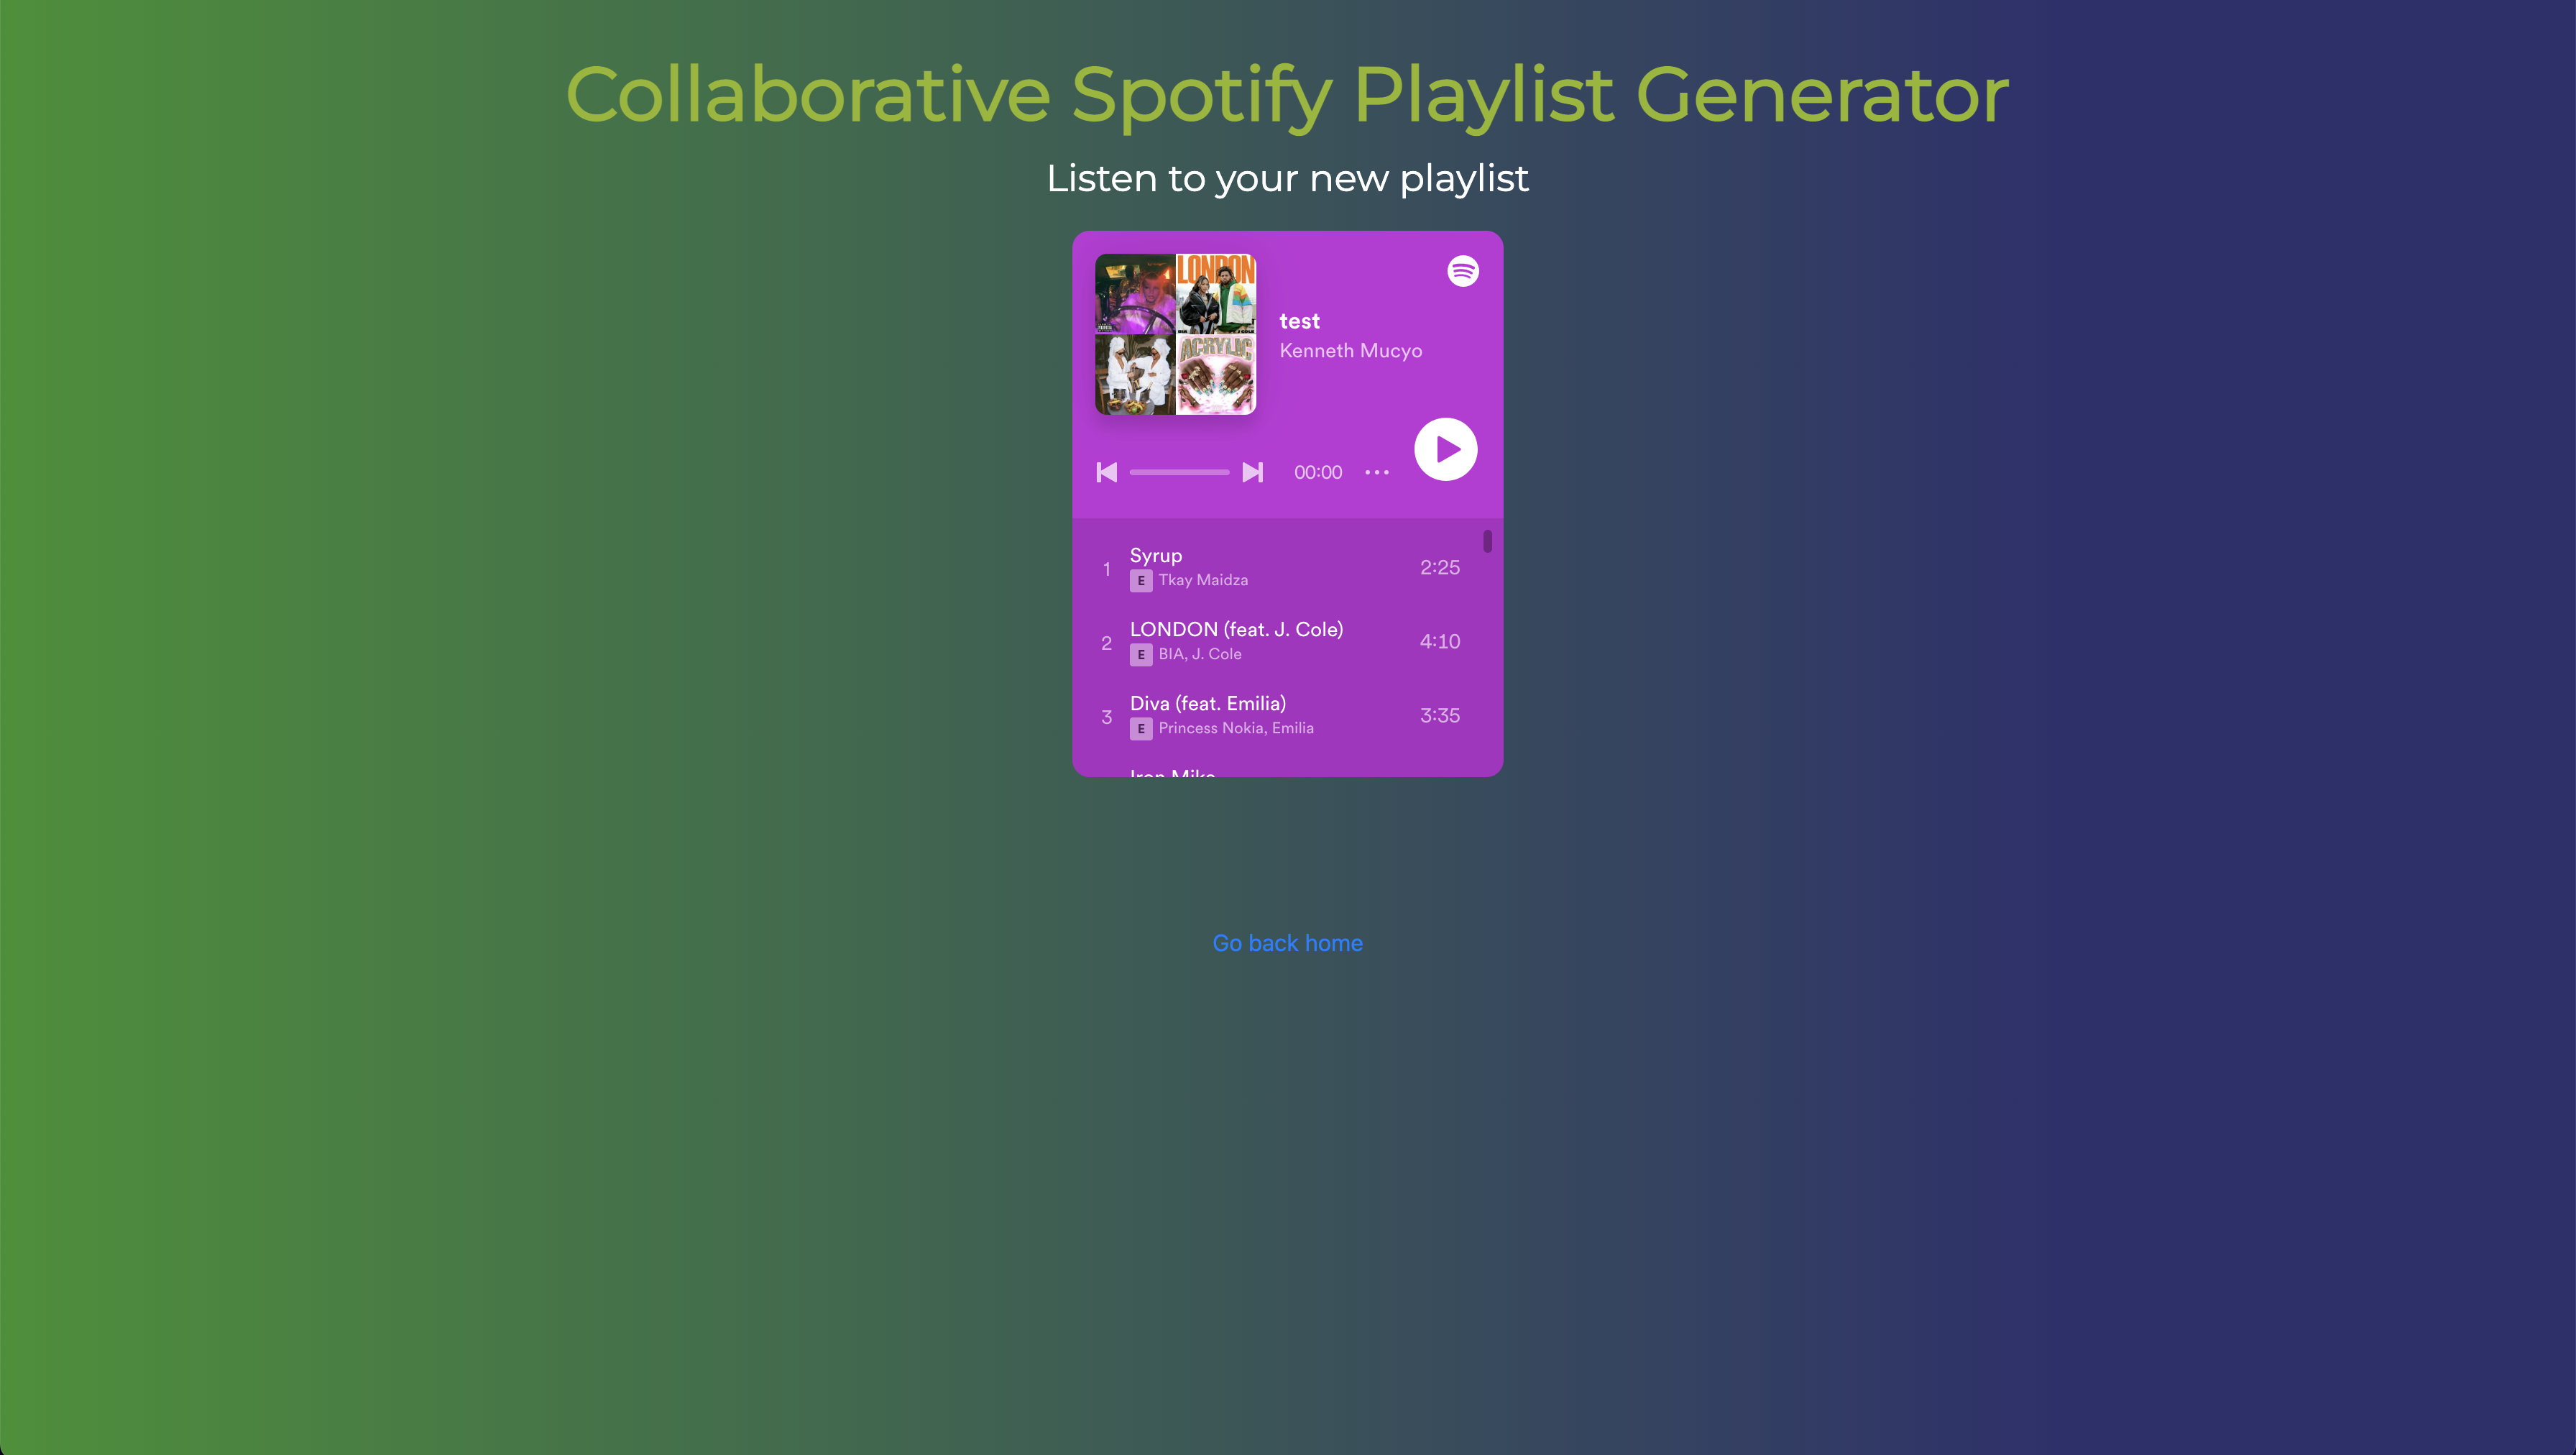
To make our tool accessible, we developed a web interface where users can log in with their Spotify accounts, select their preferred playlists, and receive a custom-generated playlist. This playlist can then be saved directly to their Spotify account or played on our platform.
-3693dd28.png)
Conclusion
Our Collaborative Spotify Playlist Generator offers a unique solution to music lovers looking to discover new tracks that align with their tastes. By leveraging the power of big data and machine learning, we've created a tool that enhances the music streaming experience, making it more social and exploratory.
Please refer to the completed Github repository: https://github.com/Qulxis/spotify-big-data-project